Formulas you can watch, drag and take apart.
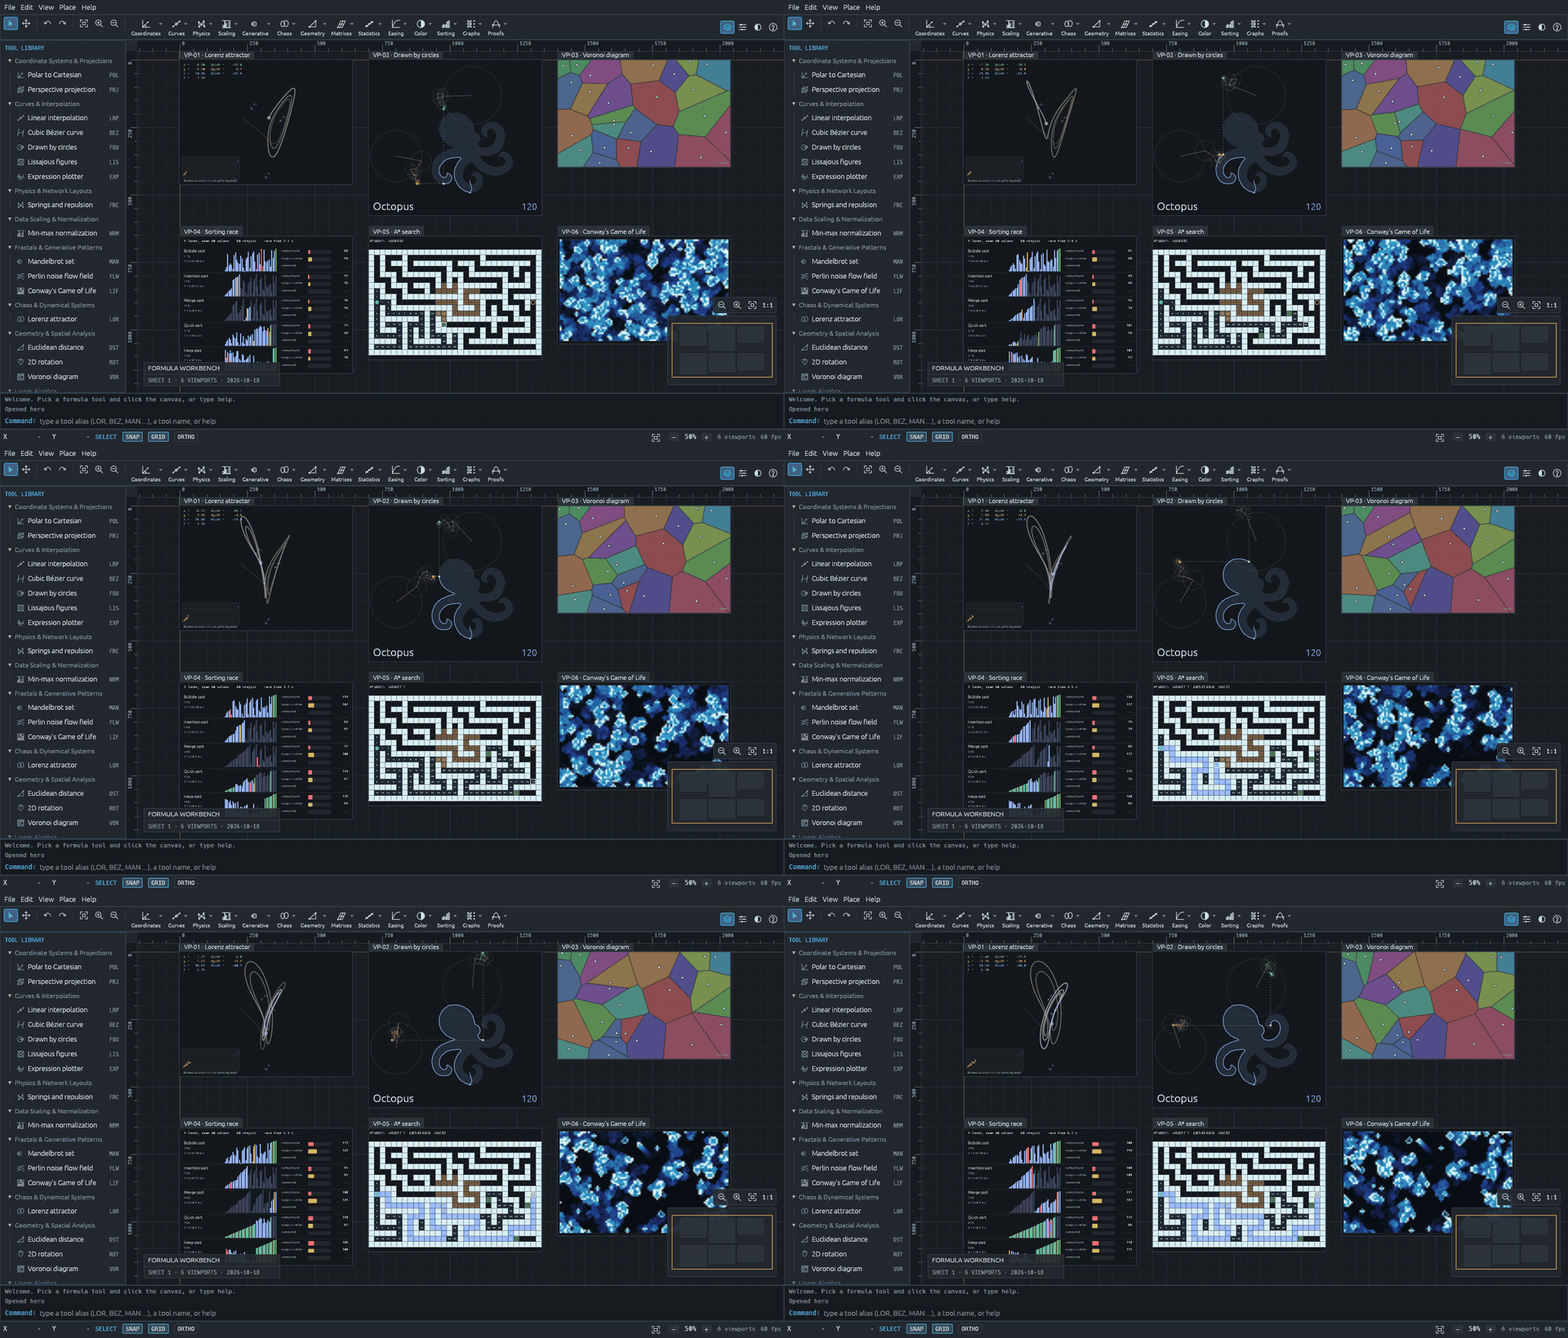
A CAD-style workbench with 39 live formulas, from polar coordinates to the Lorenz attractor, sorting, pathfinding and proofs.
Each formula is a resizable viewport on an infinite drafting canvas. It comes with its reference docs, step-by-step derivations, and working Python, TypeScript and Rust code.
Runs in your browser with WebAssembly. Best on a desktop with a mouse. Or download the desktop app for macOS, Windows or Linux.
What you can do
Everything happens on one board, the way you'd lay out a drawing.
Place formulas on an infinite canvas
Click a tool to place it, or drag out its size. Move, resize, duplicate, lock, hide and undo, with snapping and smart guides. Every viewport keeps animating at any zoom.
Get your hands on it
Drag points, paint cells, draw walls, orbit 3D views, and scrub through every step of an algorithm like a video.
See it explained
The Inspector shows each formula's equations, controls and full docs. The Derive tab works the equations out with the viewport's own numbers, one operation at a time.
Take the code with you
Export Python (numpy and matplotlib), TypeScript and Rust programs, LaTeX with the current values, or a ready-to-run Jupyter notebook.
Save the whole board
A sheet is a plain-text .fwb file with every formula's settings. Open one later and pick up where you left off.
Link to a formula
Every tool has its own address, like /app/#mandelbrot, so you can share exactly what you're looking at.
Showcase
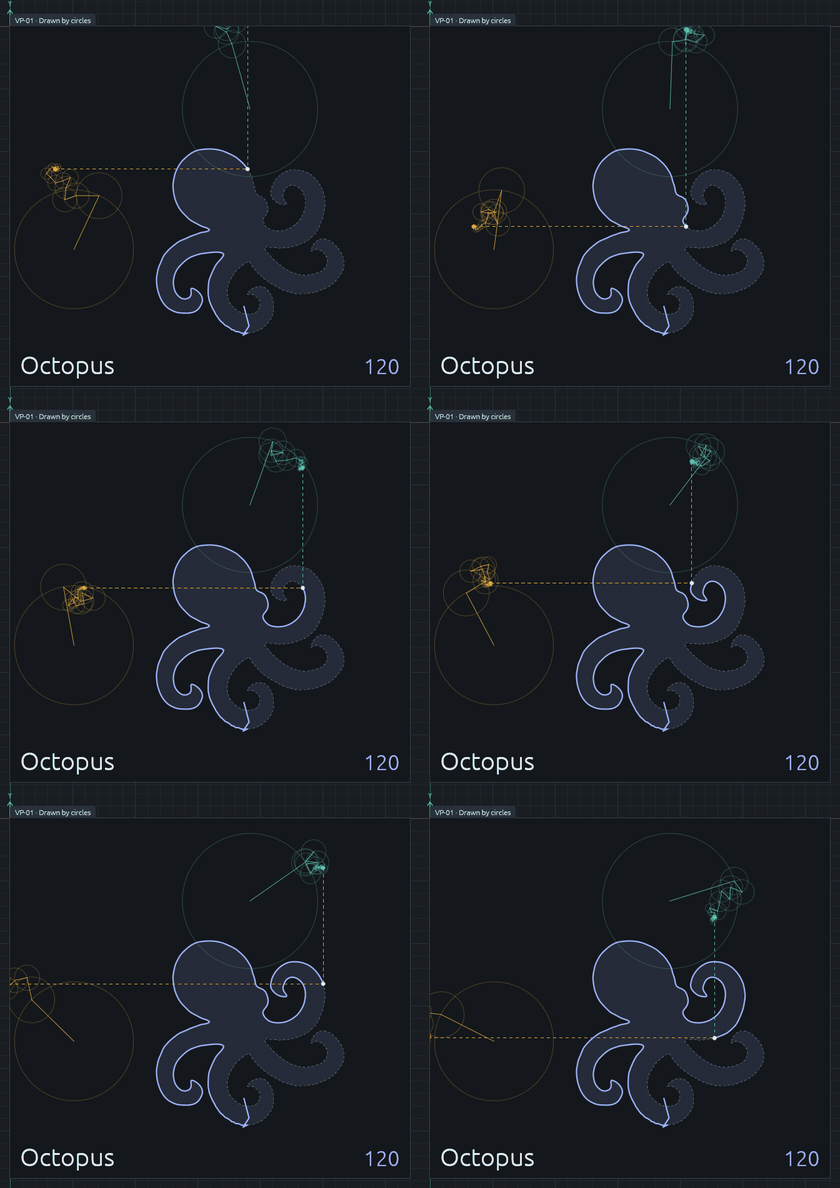
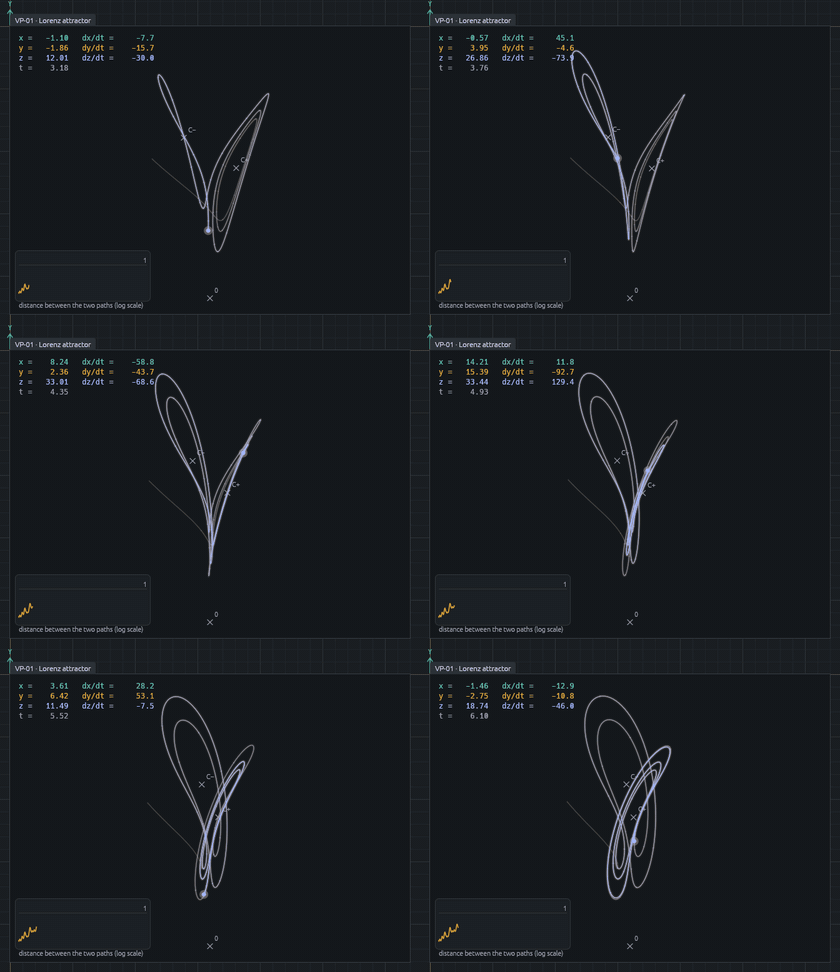
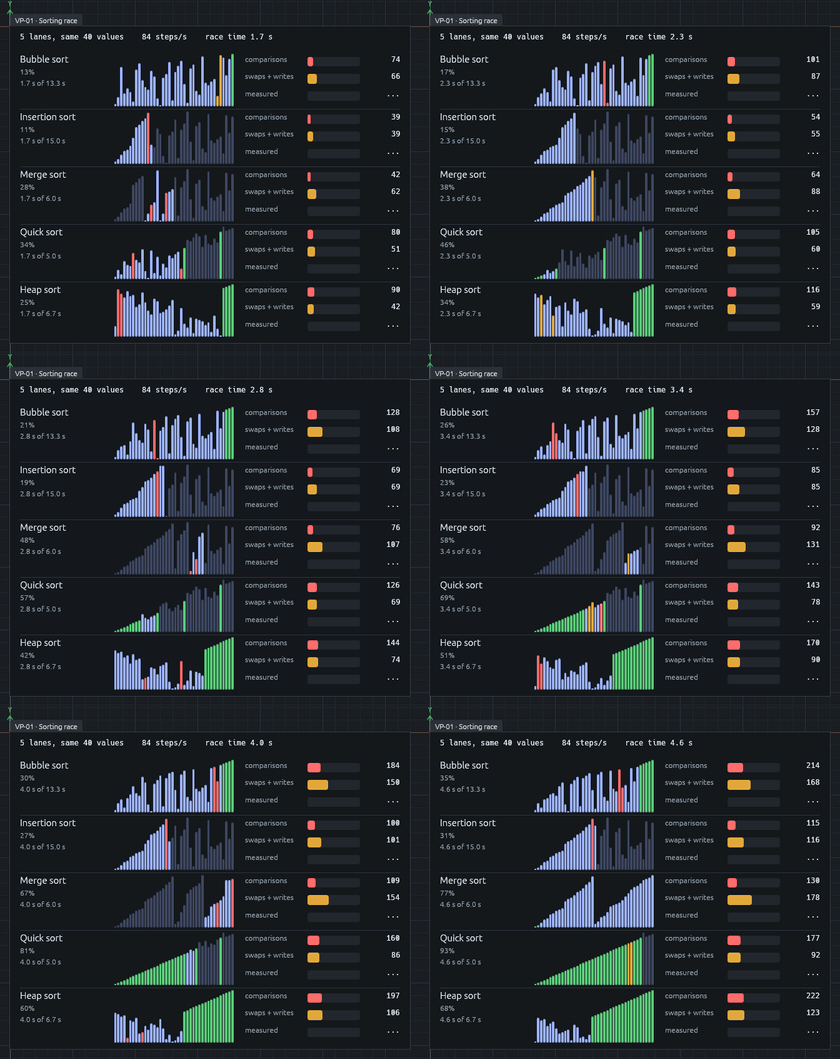
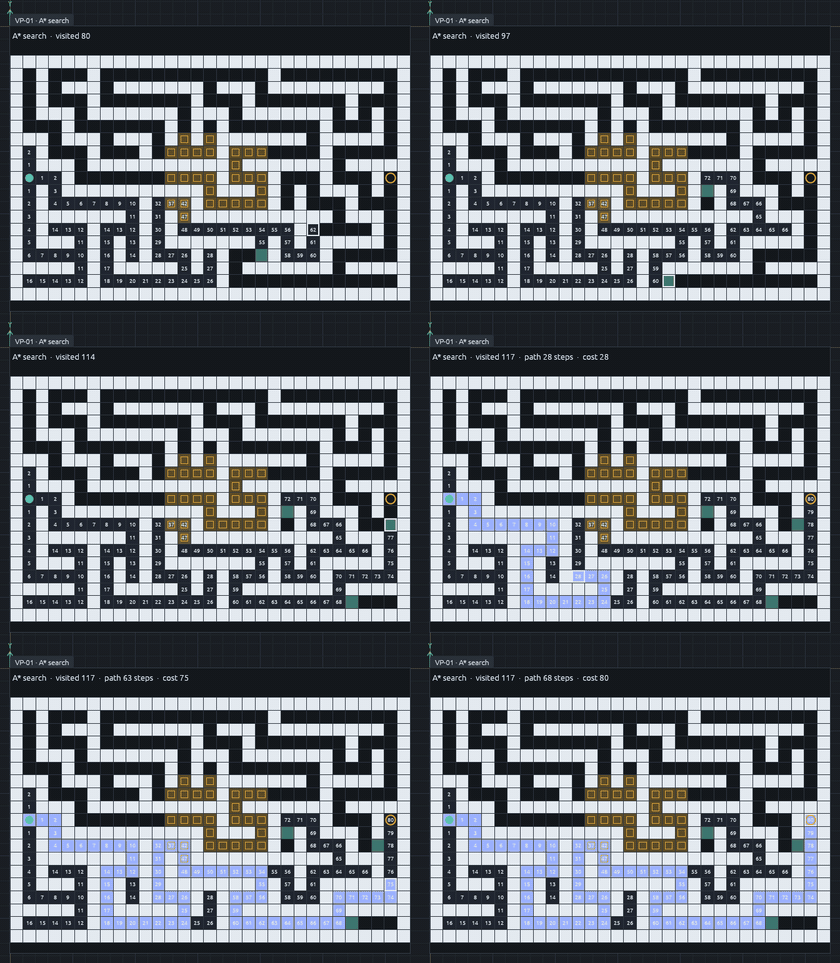
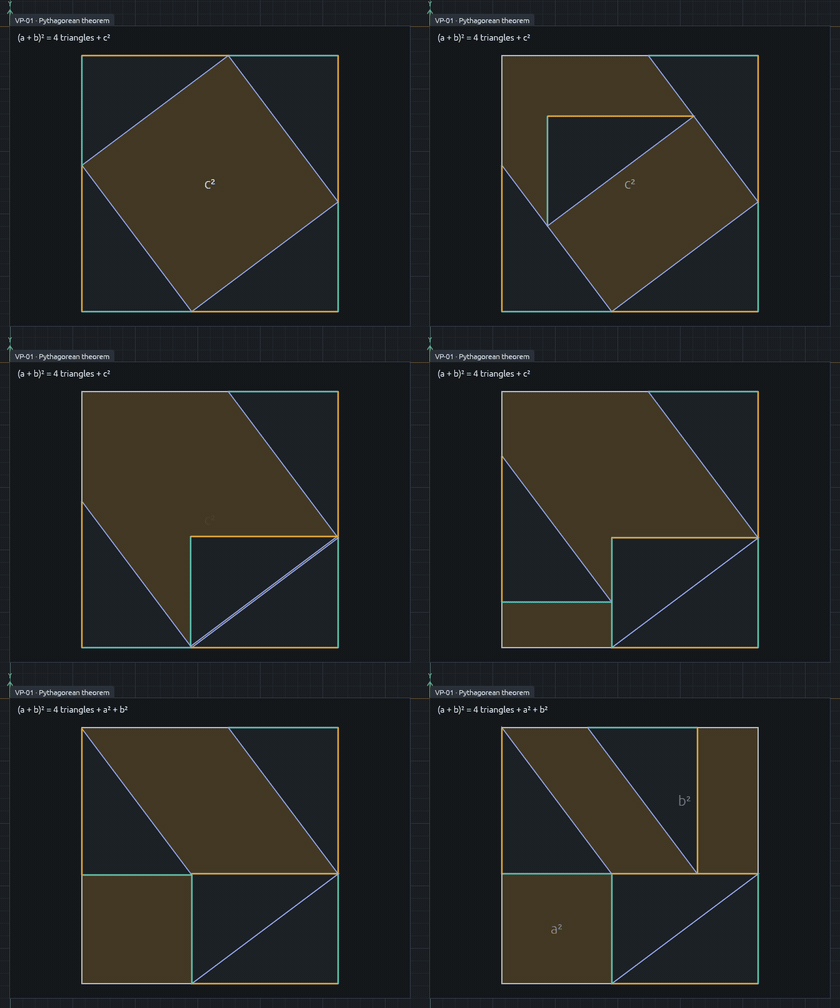
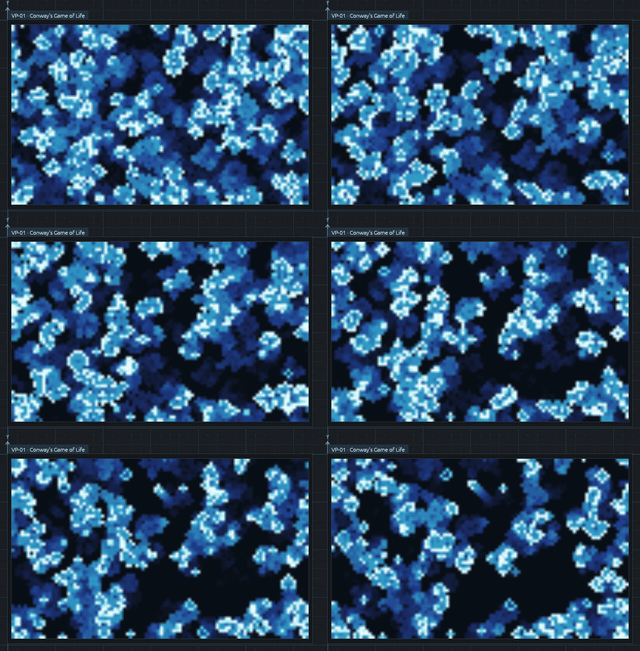
Six of the formulas, recorded from the workbench. Click one to open it live.
All 39 formulas
Grouped as in the workbench's tool library. Each card opens that formula in the browser.
- Coordinate Systems & Projections
- Curves & Interpolation
- Physics & Network Layouts
- Data Scaling & Normalization
- Fractals & Generative Patterns
- Chaos & Dynamical Systems
- Geometry & Spatial Analysis
- Linear Algebra
- Statistics & Trend Analysis
- Animation & Easing
- Color & Accessibility
- Sorting
- Graphs & Trees
- Proofs & Derivations
Coordinate Systems & Projections 2
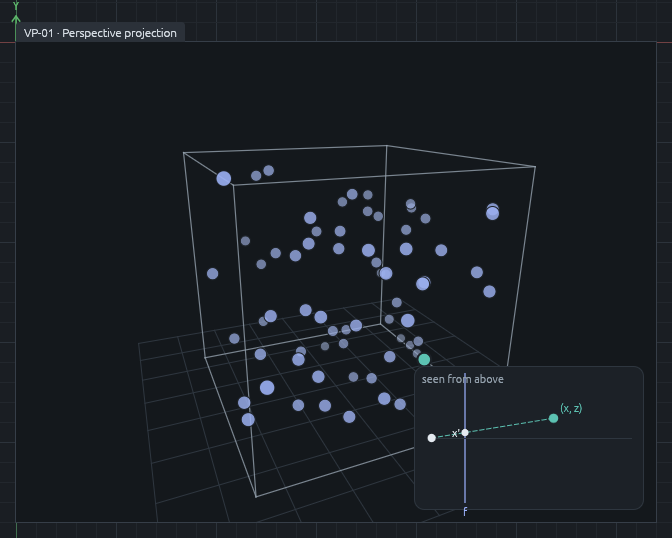
Curves & Interpolation 5
Linear interpolation
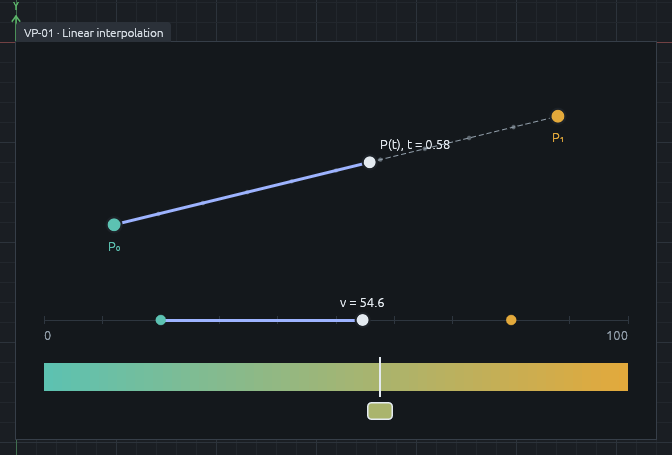
Drag the endpoints; blend positions, plain numbers and colors.
Cubic Bézier curve
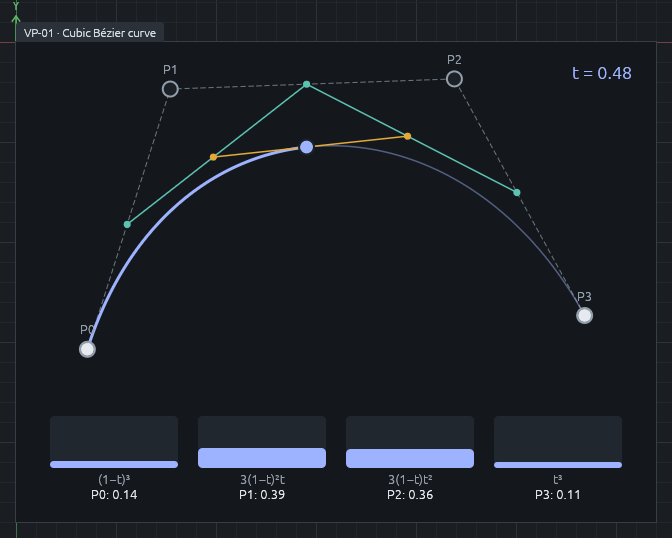
Drag the control points; see de Casteljau's lerps of lerps and the Bernstein weights.
Drawn by circles
Pick one of 64 animals; slide the number of circles down and watch the details melt away.
Lissajous figures
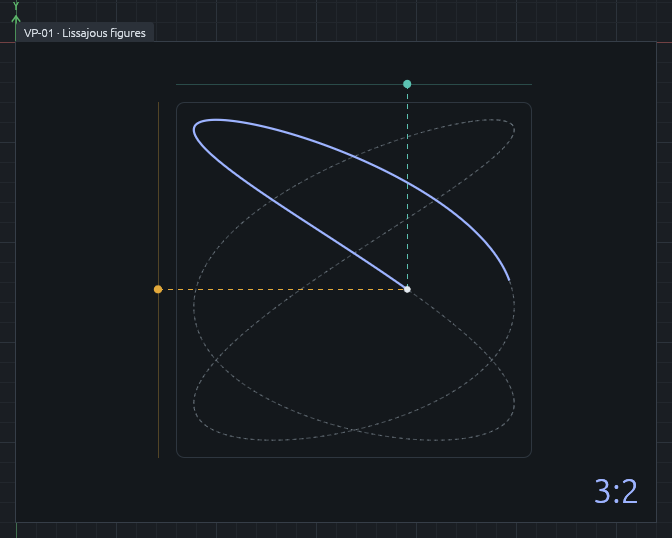
Set amplitudes, frequencies and phase; δ drifts so the figure morphs and seems to turn in 3D.
Expression plotter
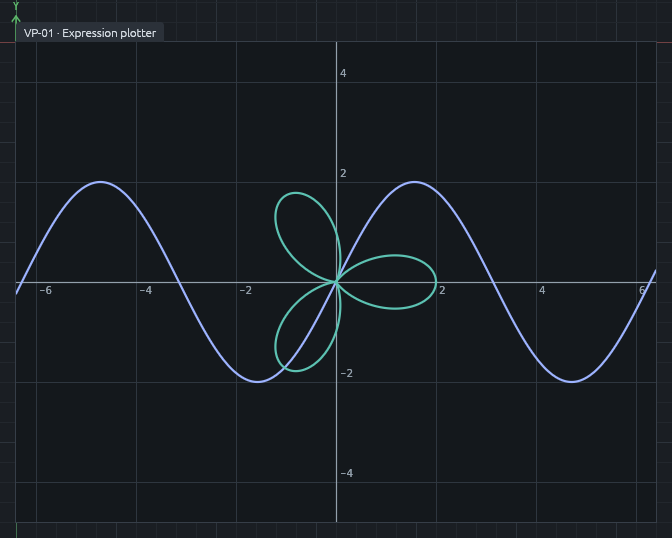
Type up to six rows; every free letter gets a slider. Drag to pan, scroll to zoom; the code export contains your expressions.
Physics & Network Layouts 1
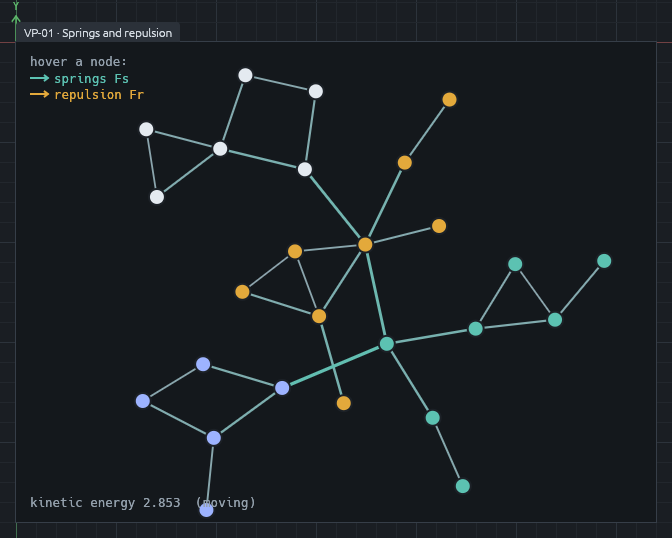
Data Scaling & Normalization 1
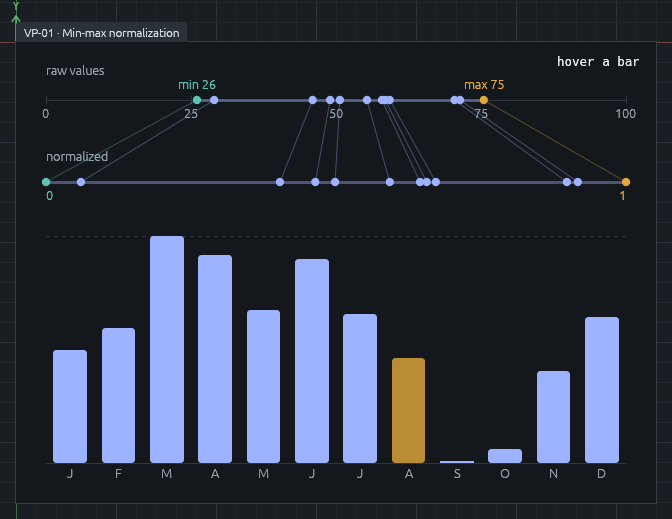
Fractals & Generative Patterns 3
Mandelbrot set
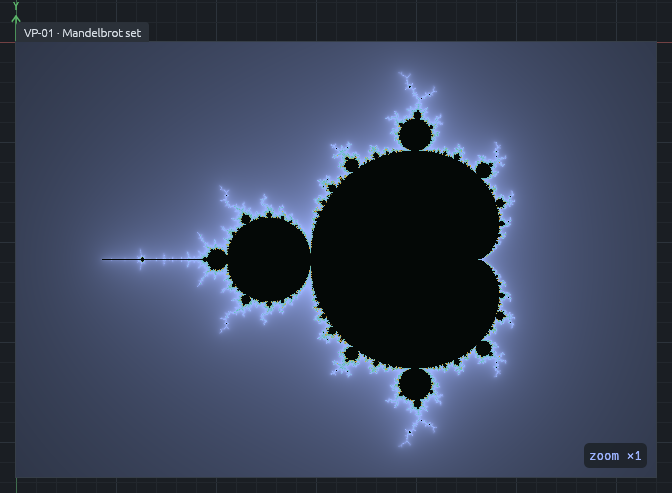
Click to zoom in, right-click to zoom out, drag to pan; hover to see a point's orbit.
Perlin noise flow field
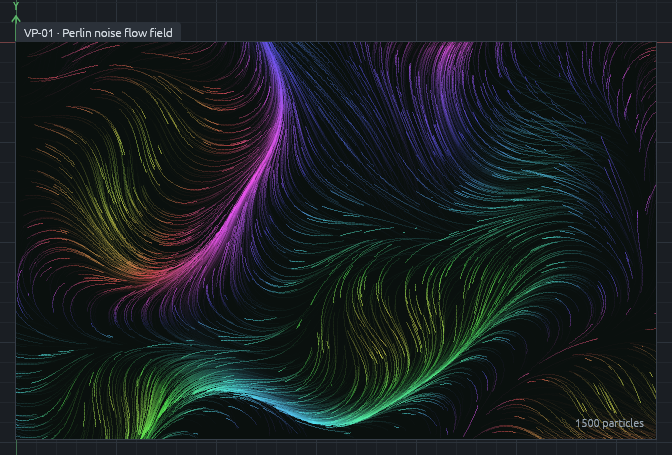
Particles with fading trails follow the noise; hover to read the field, or show the vectors.
Conway's Game of Life
Draw and erase cells, load classic patterns, hover a cell to see the rule at work.
Chaos & Dynamical Systems 1
Geometry & Spatial Analysis 3
Euclidean distance
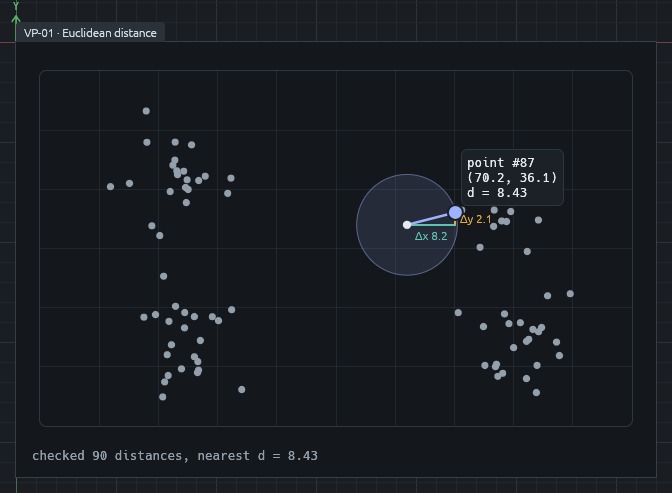
Move the mouse to find the nearest point, or switch to K-means and watch clusters form.
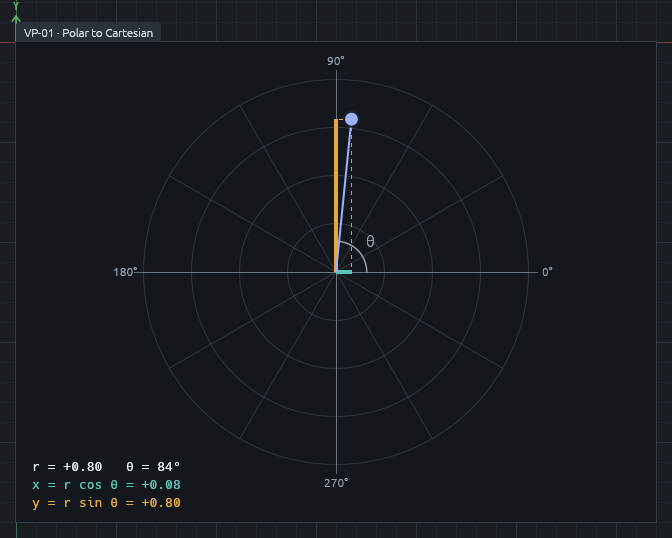
2D rotation
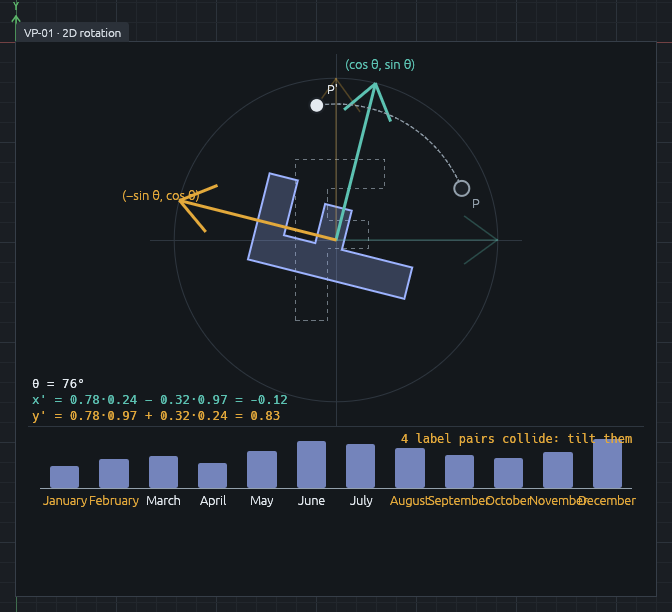
Drag the point; tilt the crowded month labels until they stop colliding.
Voronoi diagram
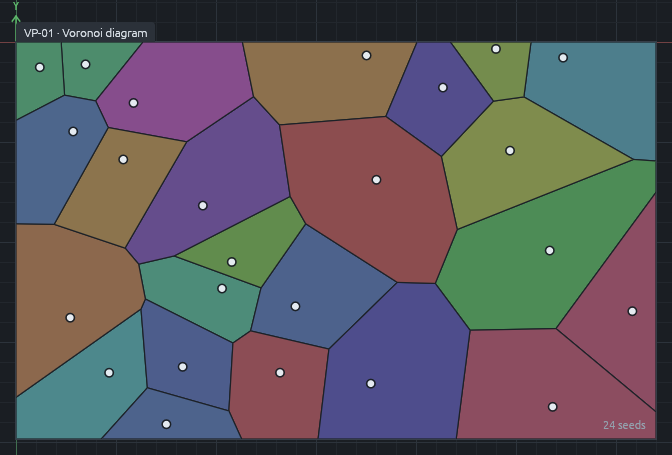
Drag, add and remove seeds; Lloyd relaxation, Delaunay edges, giraffe, cracked-mud and dragonfly-wing styles.
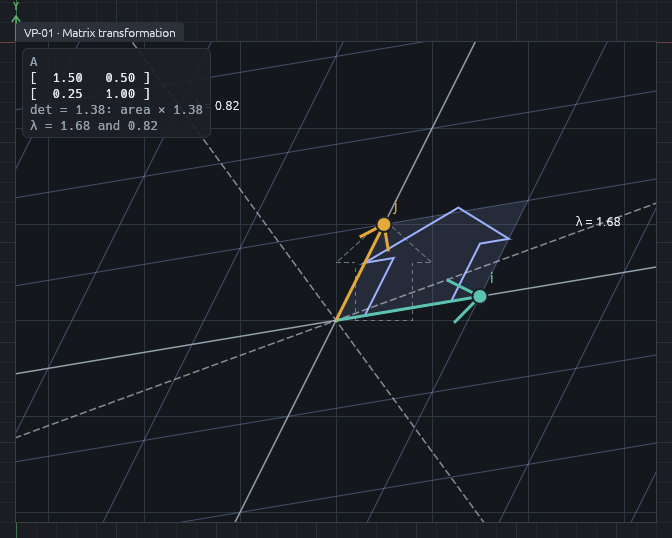
Statistics & Trend Analysis 1
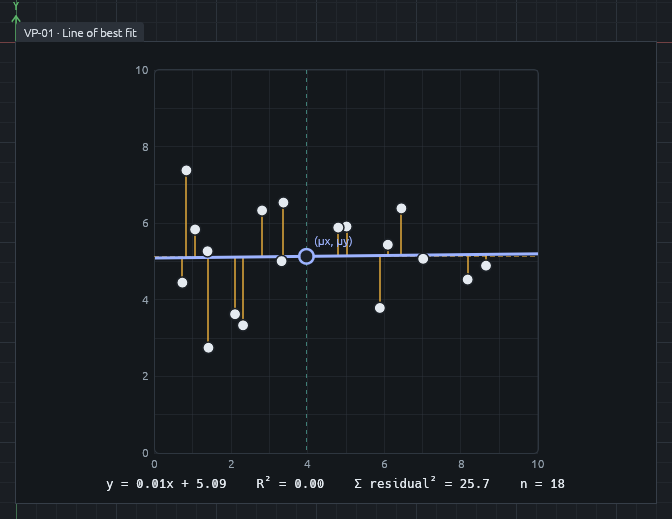
Animation & Easing 1
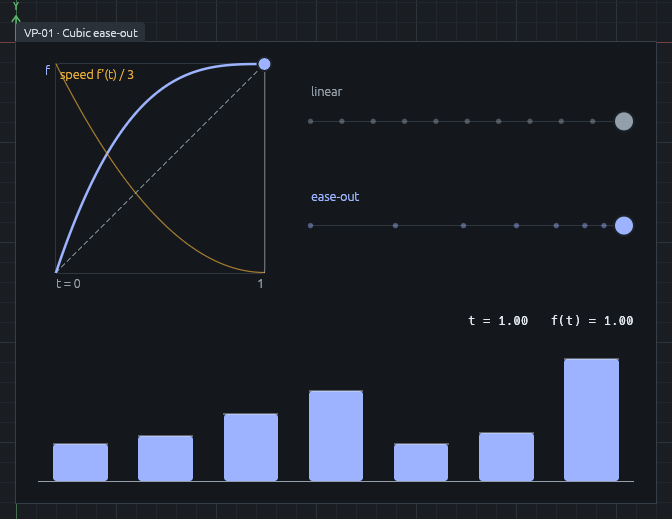
Color & Accessibility 1
Sorting 9
Bubble sort
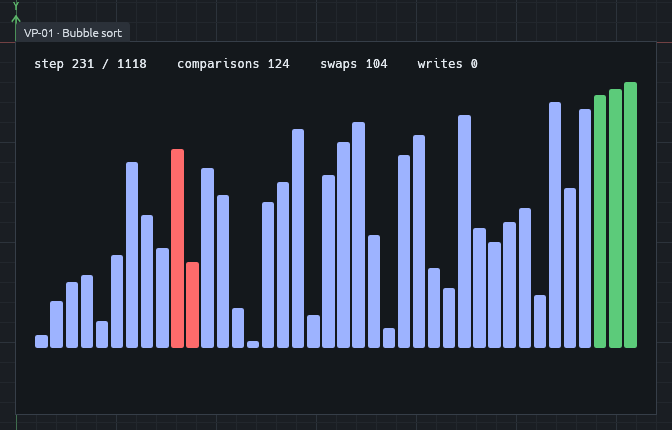
Neighbours swap until each pass carries the largest value to the end.
Selection sort
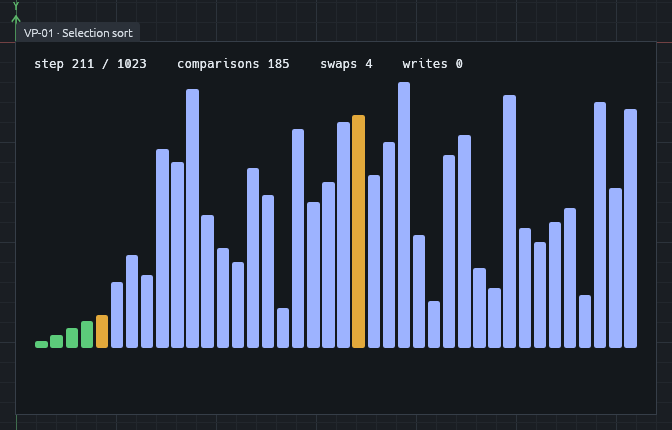
The smallest unsorted value (purple) is swapped to the front.
Insertion sort
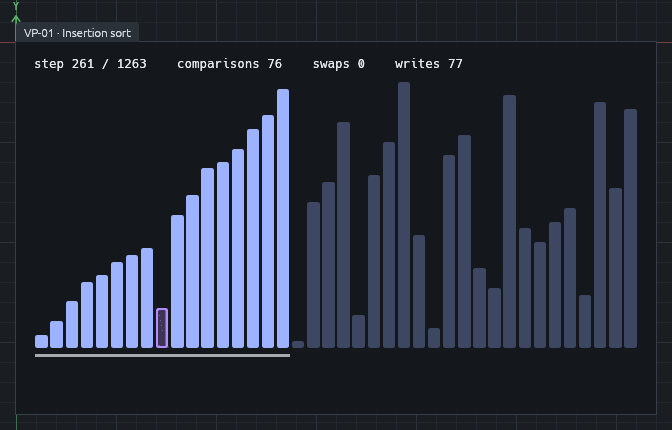
Each key slides left into place; try the Nearly sorted preset.
Merge sort
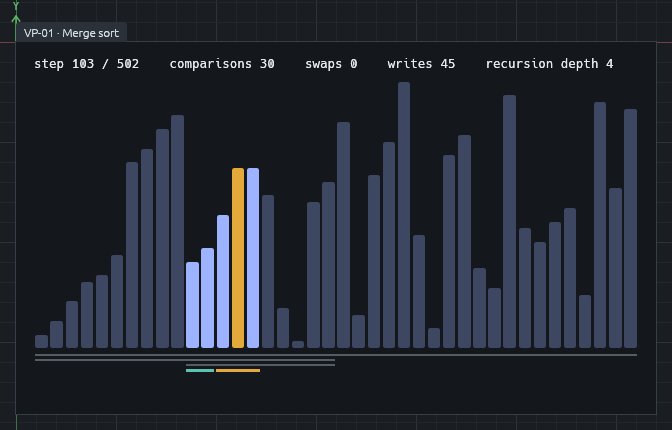
Split into halves, then merge them back; brackets show the recursion.
Quick sort
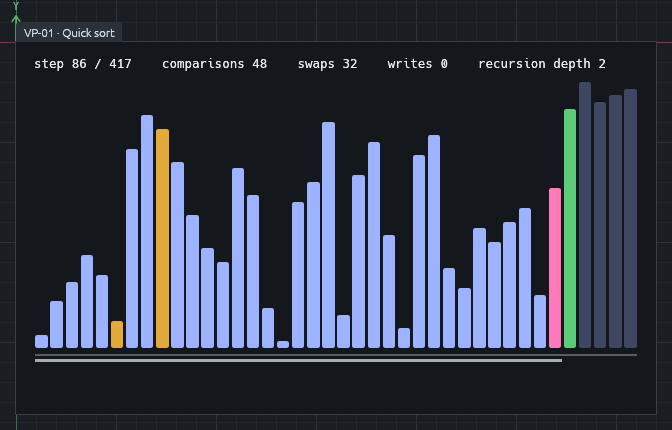
Partition around the pivot (pink), then sort each side.
Quick sort (3-way)
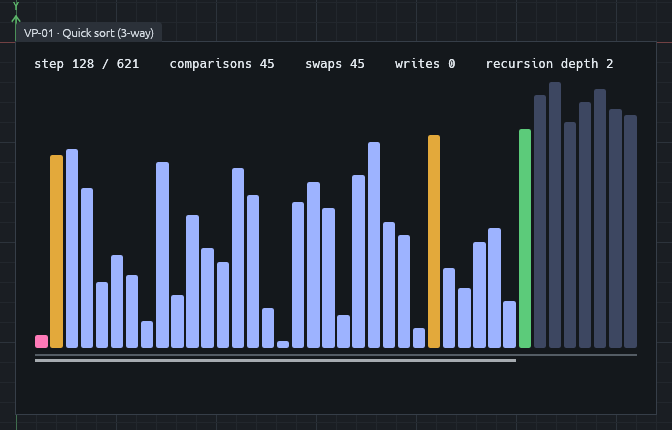
Keys equal to the pivot gather in the middle; try Few unique.
Heap sort
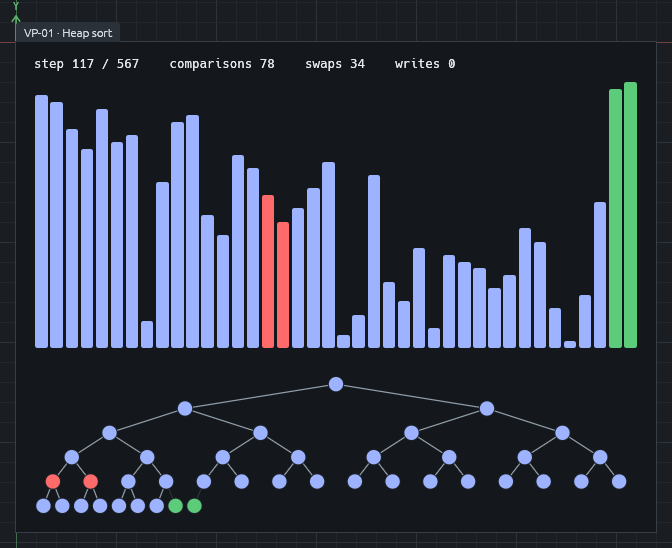
The list drawn as a heap: build it, then pull out the largest each time.
Counting sort
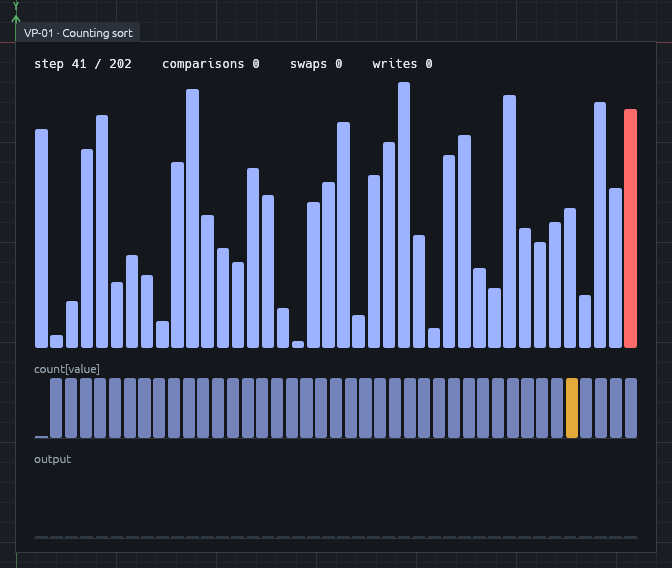
Tally every value, then write the output straight from the counts.
Sorting race
Race the algorithms you pick, with live comparisons, moves and a measured time.
Graphs & Trees 7
Breadth-first search
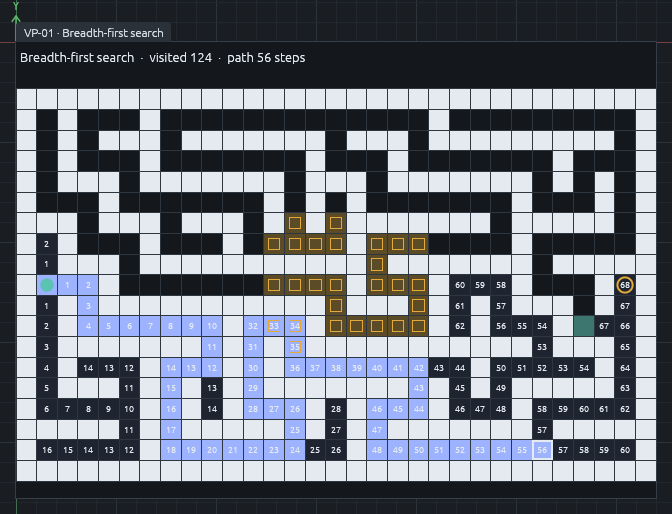
Explores in rings of equal distance, so its first path is the shortest in steps.
Depth-first search
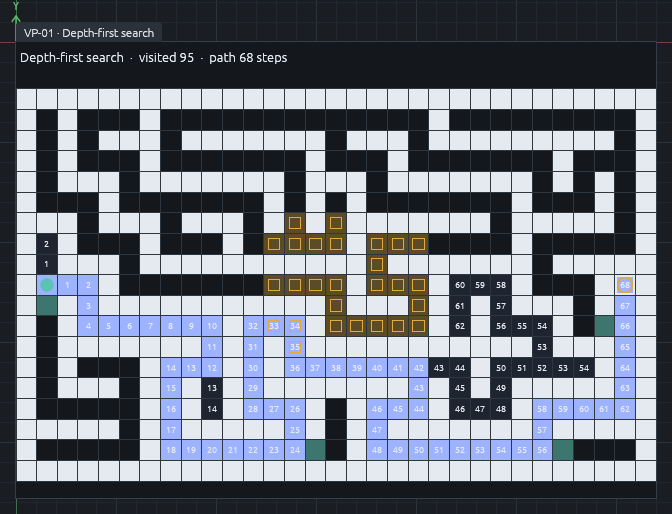
Dives down one corridor before backing up; finds a path, rarely the shortest.
Dijkstra's algorithm
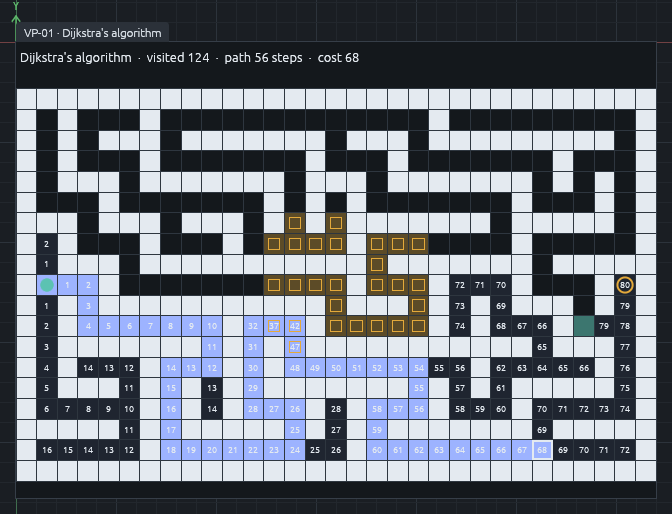
Settles cells by total cost, so it walks around mud when a detour is cheaper.
A* search
Dijkstra steered by a straight-line guess of the distance left; visits fewer cells.
Binary search tree
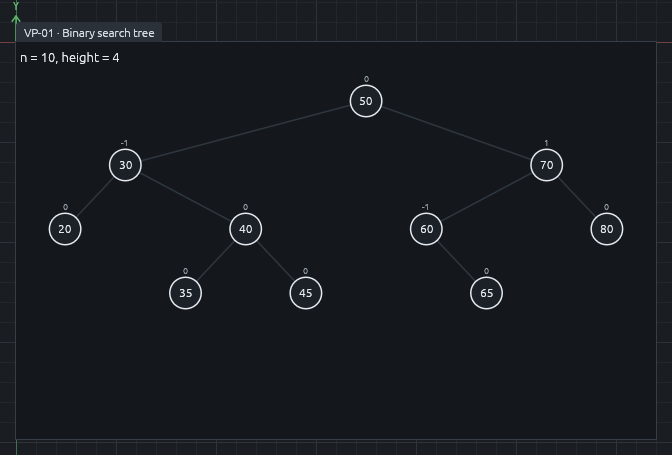
Insert, delete and find keys; toggle AVL; in-, pre- and post-order walks; rotations glide into place.
Kruskal's algorithm
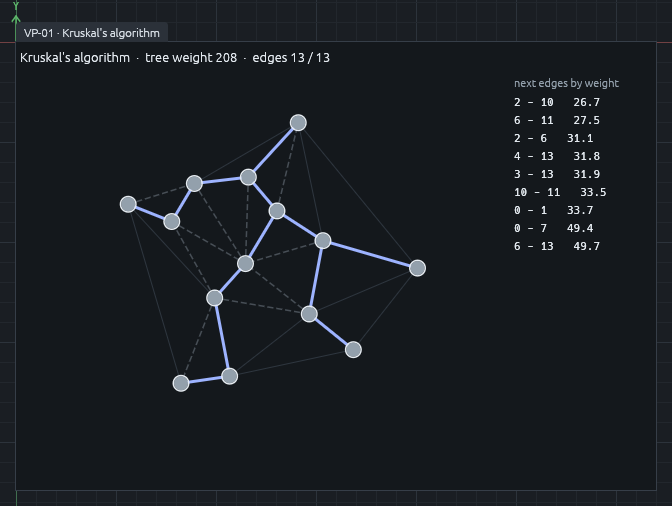
Takes edges by weight, keeping each one that joins two trees; drag the points.
Prim's algorithm
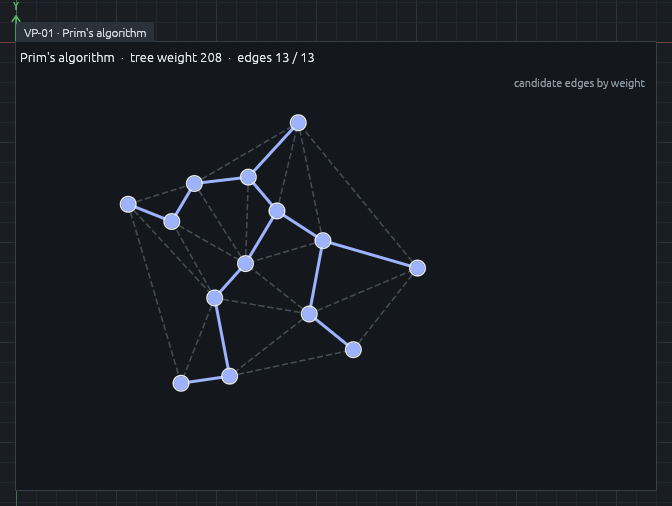
Grows one tree from a vertex, always by the lightest edge leaving it.
Proofs & Derivations 3
Quadratic formula
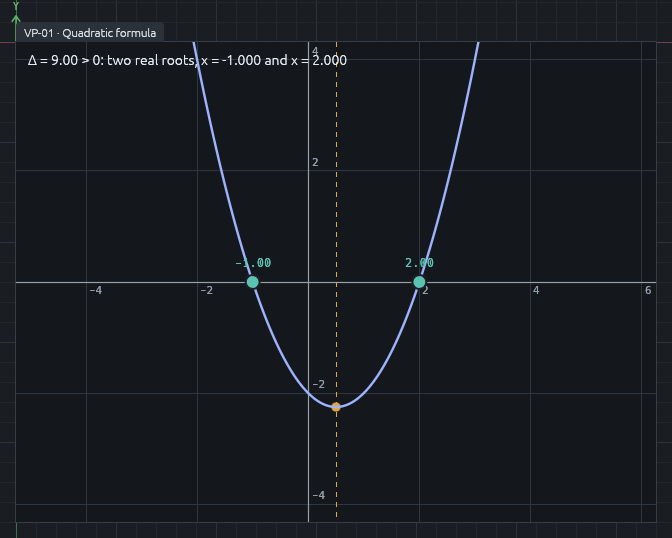
Slide a, b and c; roots, vertex and axis; the Derive tab completes the square.
Pythagorean theorem
Four triangles slide around an (a + b)² square, or the altitude splits it into two copies.
Euler's formula
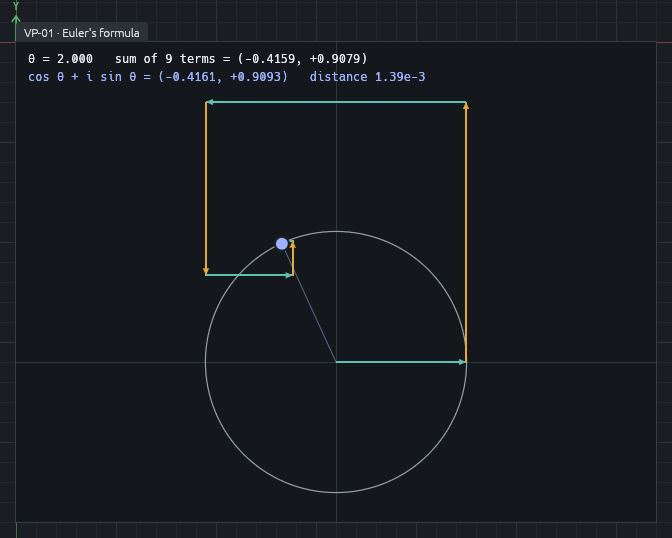
The Taylor series as arrows spiralling onto the unit circle; θ = π gives e^(iπ) + 1 = 0.